




What a 95% drop in Search investment revealed about incremental growth
Walmart Connect


What happens when a brand nearly stops advertising for a week?
In August 2026, an anonymized food brand cut its Search investment by nearly 95% for one week, creating a natural experiment for QBR Media to study. The impact was significant: average daily digital sales, measured by gross merchandise value (GMV), declined 35.1%, while in-store sales remained relatively stable.
For growing brands, the findings raise a bigger question: Is advertising actually creating additional growth, or simply taking credit for sales that would have happened anyway?
That's the question incrementality is designed to help answer. Unlike attributed metrics such as return on ad spend (ROAS), which measure sales associated with advertising, incrementality measures the additional business the advertising generated.
Using Walmart Connect daily advertising and retail reporting, QBR Media compared the brand's performance before, during and after the reduced-spend period to estimate what likely would have happened if advertising had continued at normal levels.
What happened when Search went nearly dark
During the baseline period, the brand invested an average of $6,434 per day in Search advertising. For one week, average daily investment fell to just $350 per day.
The impact showed up quickly. Average daily digital GMV declined from $35,883 to $23,293 – a difference of approximately $12,590 per day. Meanwhile, in-store GMV held steady, increasing just 0.8%.
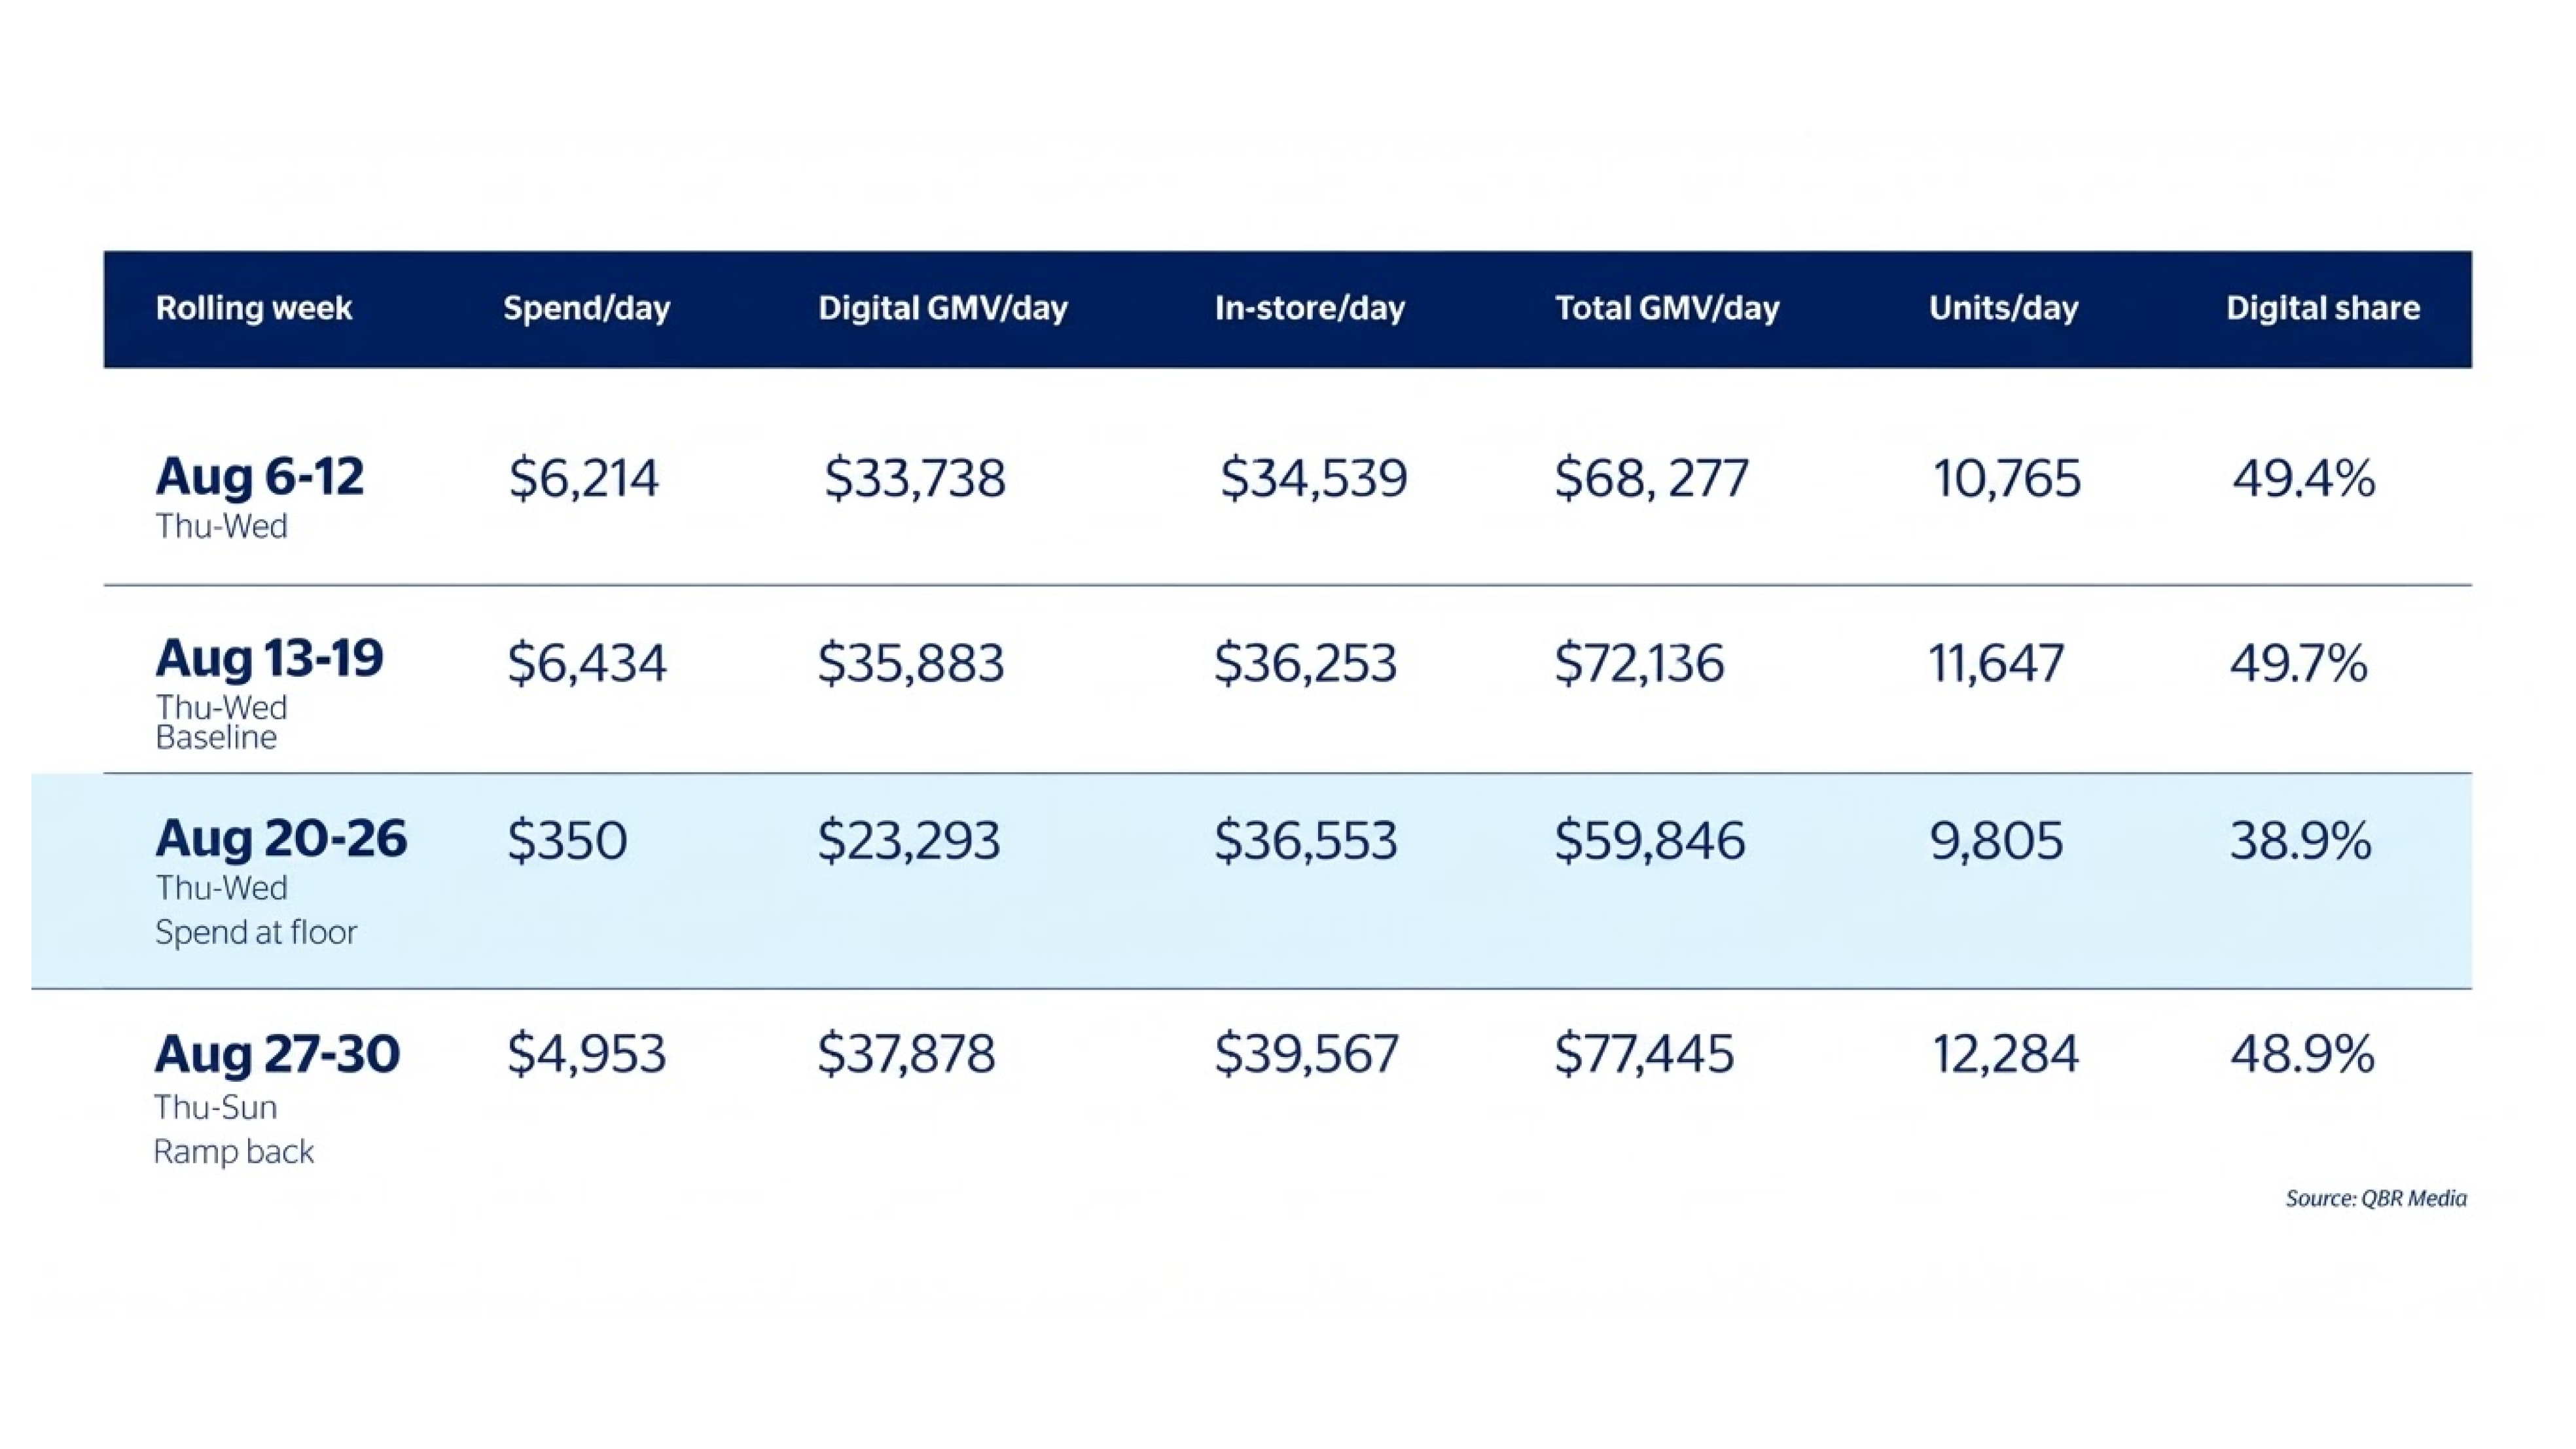
That contrast matters. If the decline simply reflected weaker overall shopper demand, we might expect digital and in-store sales to move in the same direction. Instead, the sharp decline was concentrated in digital GMV, where the impact of Search advertising would be expected to show up first.
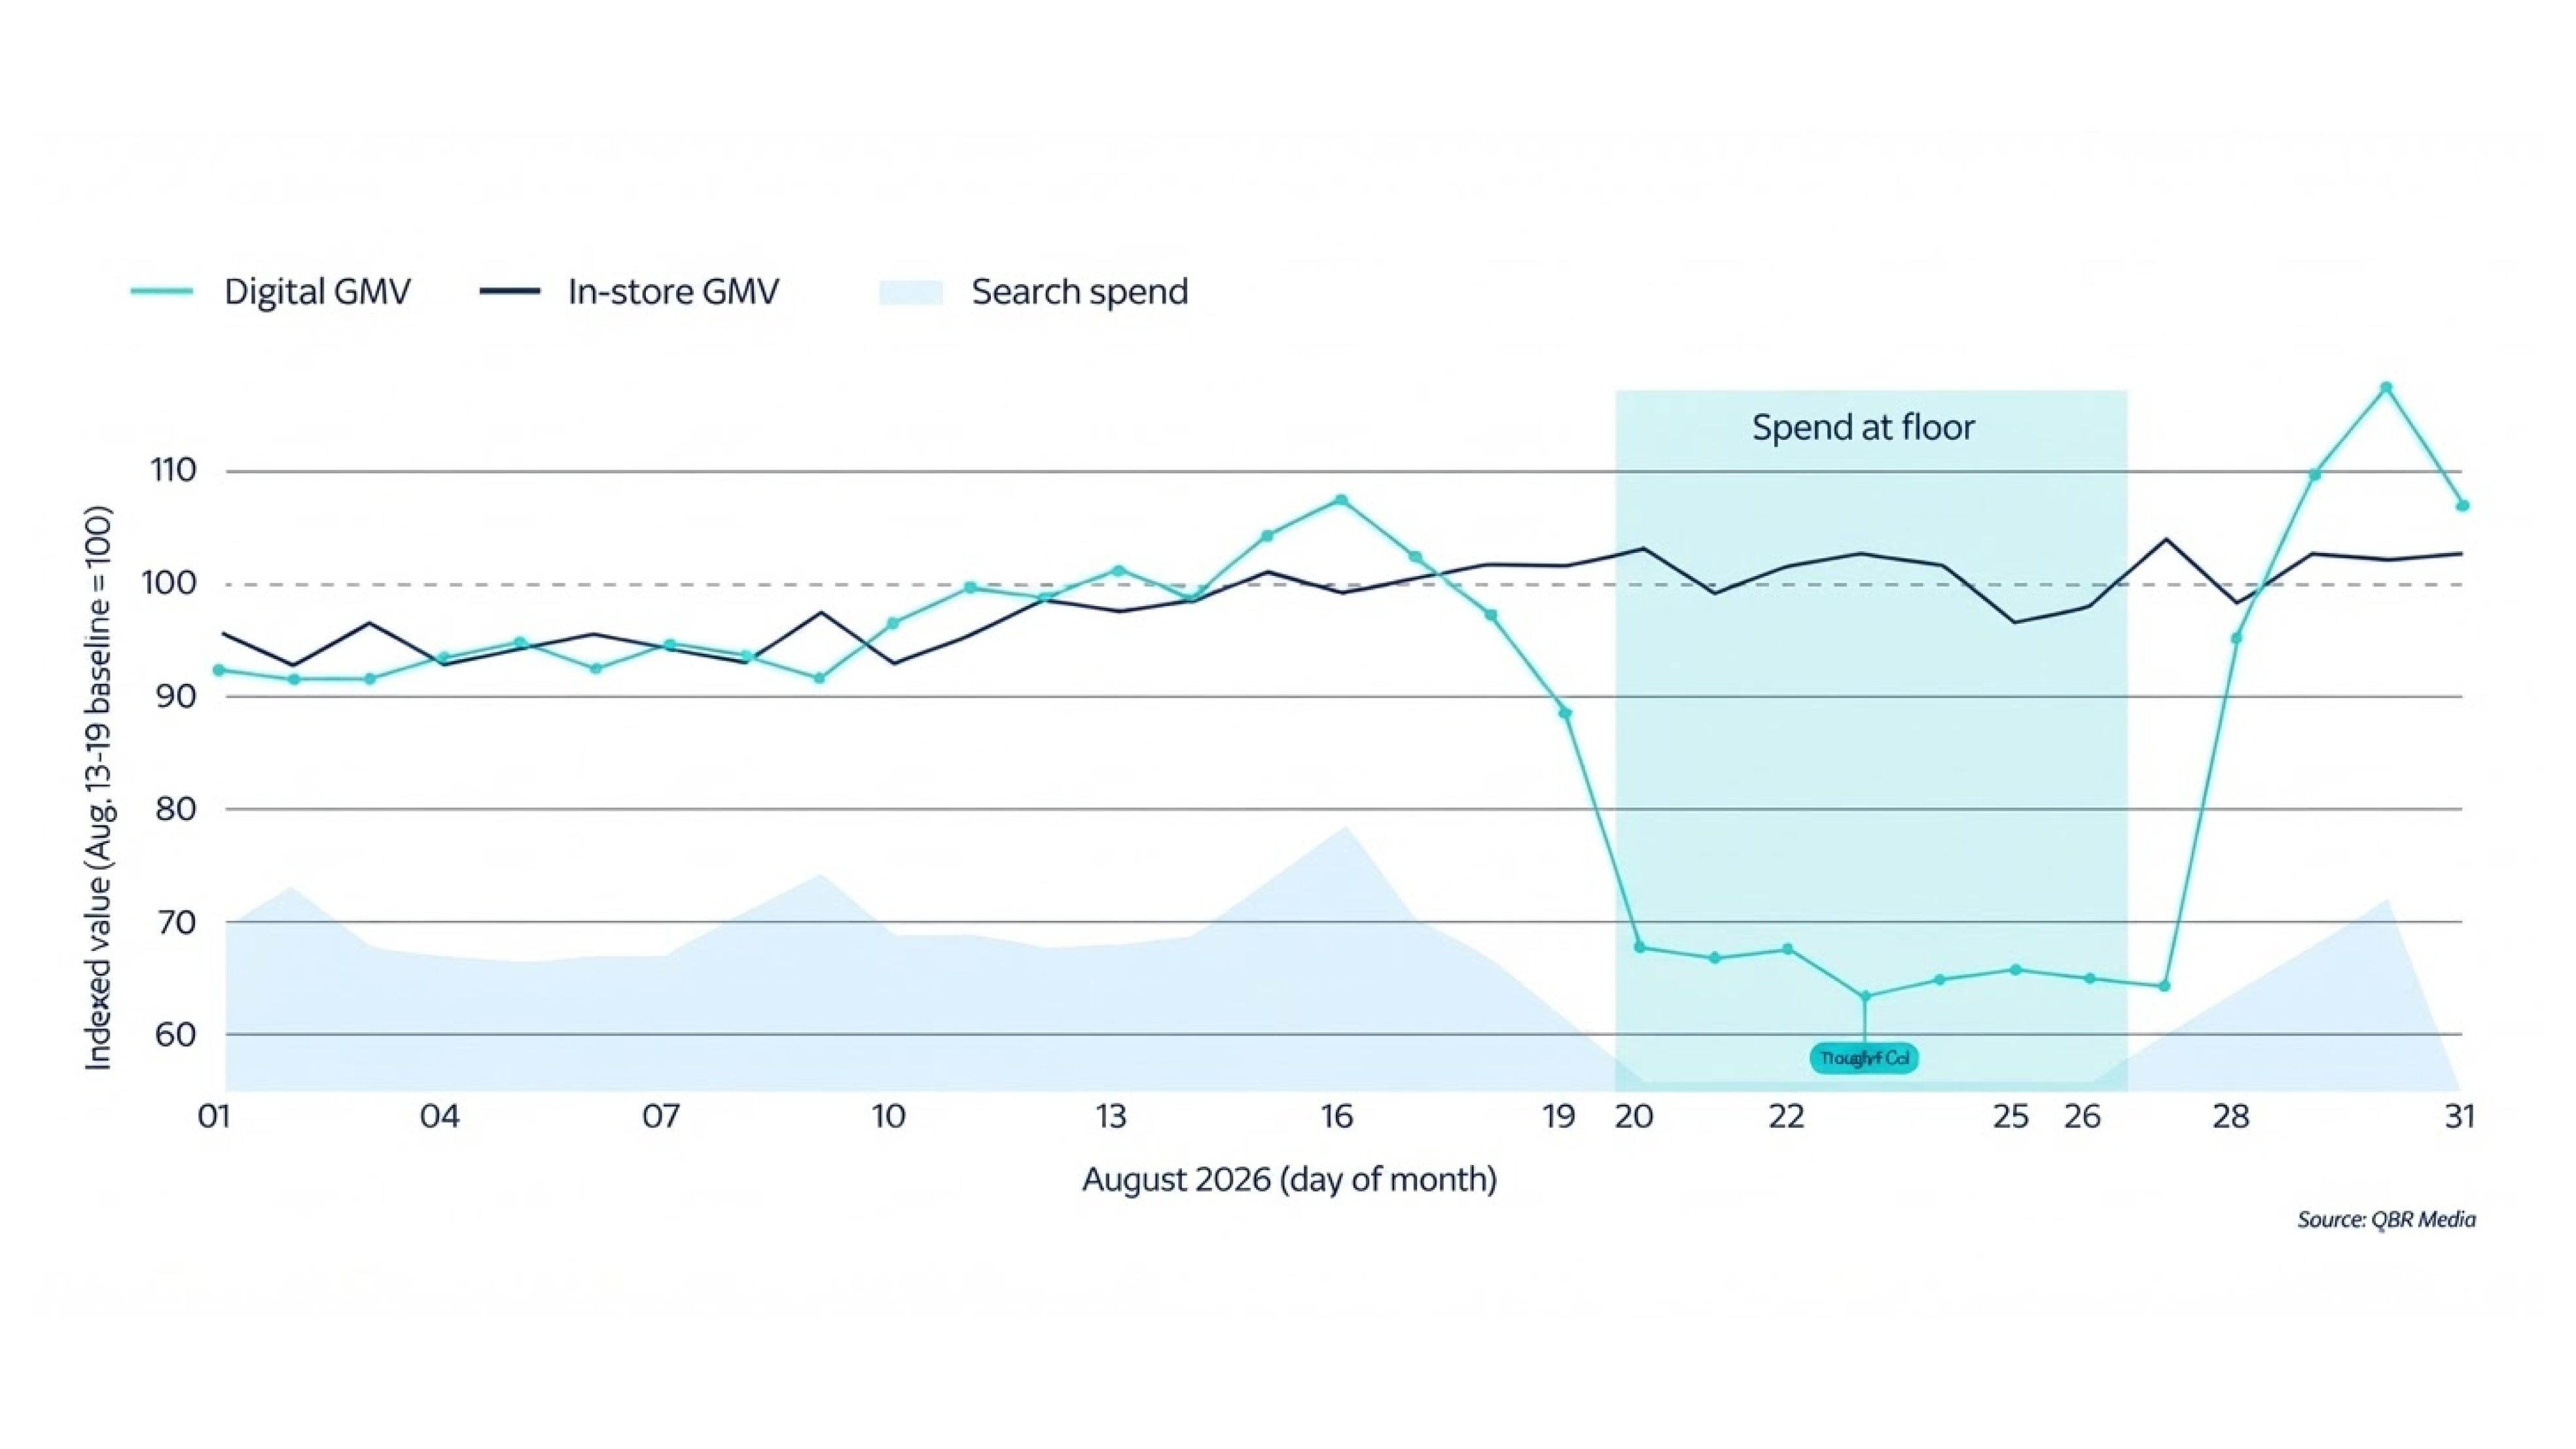
Compared with maintaining its baseline average digital GMV for seven days, the brand generated approximately $88,000 less in digital GMV during the reduced-spend period. For a growing brand, that puts the potential business impact into perspective — and shows why attributed sales alone may leave an important part of the growth story unseen.
The results held up under closer analysis
A drop in sales alone doesn't prove advertising caused it. Demand naturally changes from day to day, which is why QBR tested several alternative explanations, including day-of-week effects and broader changes in demand. The pattern remained consistent. The analysis suggests Search generated incremental business the brand likely would not have captured otherwise.
QBR's analysis estimated $2.15 in incremental total GMV for every $1 of Search spend during the test. Unlike ROAS, this estimate is designed to capture additional business generated, not simply sales attributed to advertising.
The impact extended beyond immediate sales
ROAS is an important measure of advertising performance, but it's only one lens on how advertising contributes to broader business growth. Separately, Walmart Connect's internal analysis of the same brand and time period surfaced another directional signal.
During the reduced-spend period, the brand didn't just see lower digital GMV. Its share of sales from new-to-brand (NTB) customers also declined by roughly eight percentage points, before rebounding during the spend ramp-up period. Because the analysis was conducted within the 14-day attribution window, these findings should be treated as directional rather than final.
The recovery wasn't immediate, either. As Search investment began ramping back up, digital penetration initially remained below baseline, suggesting the effects of going dark may linger after spending resumes.
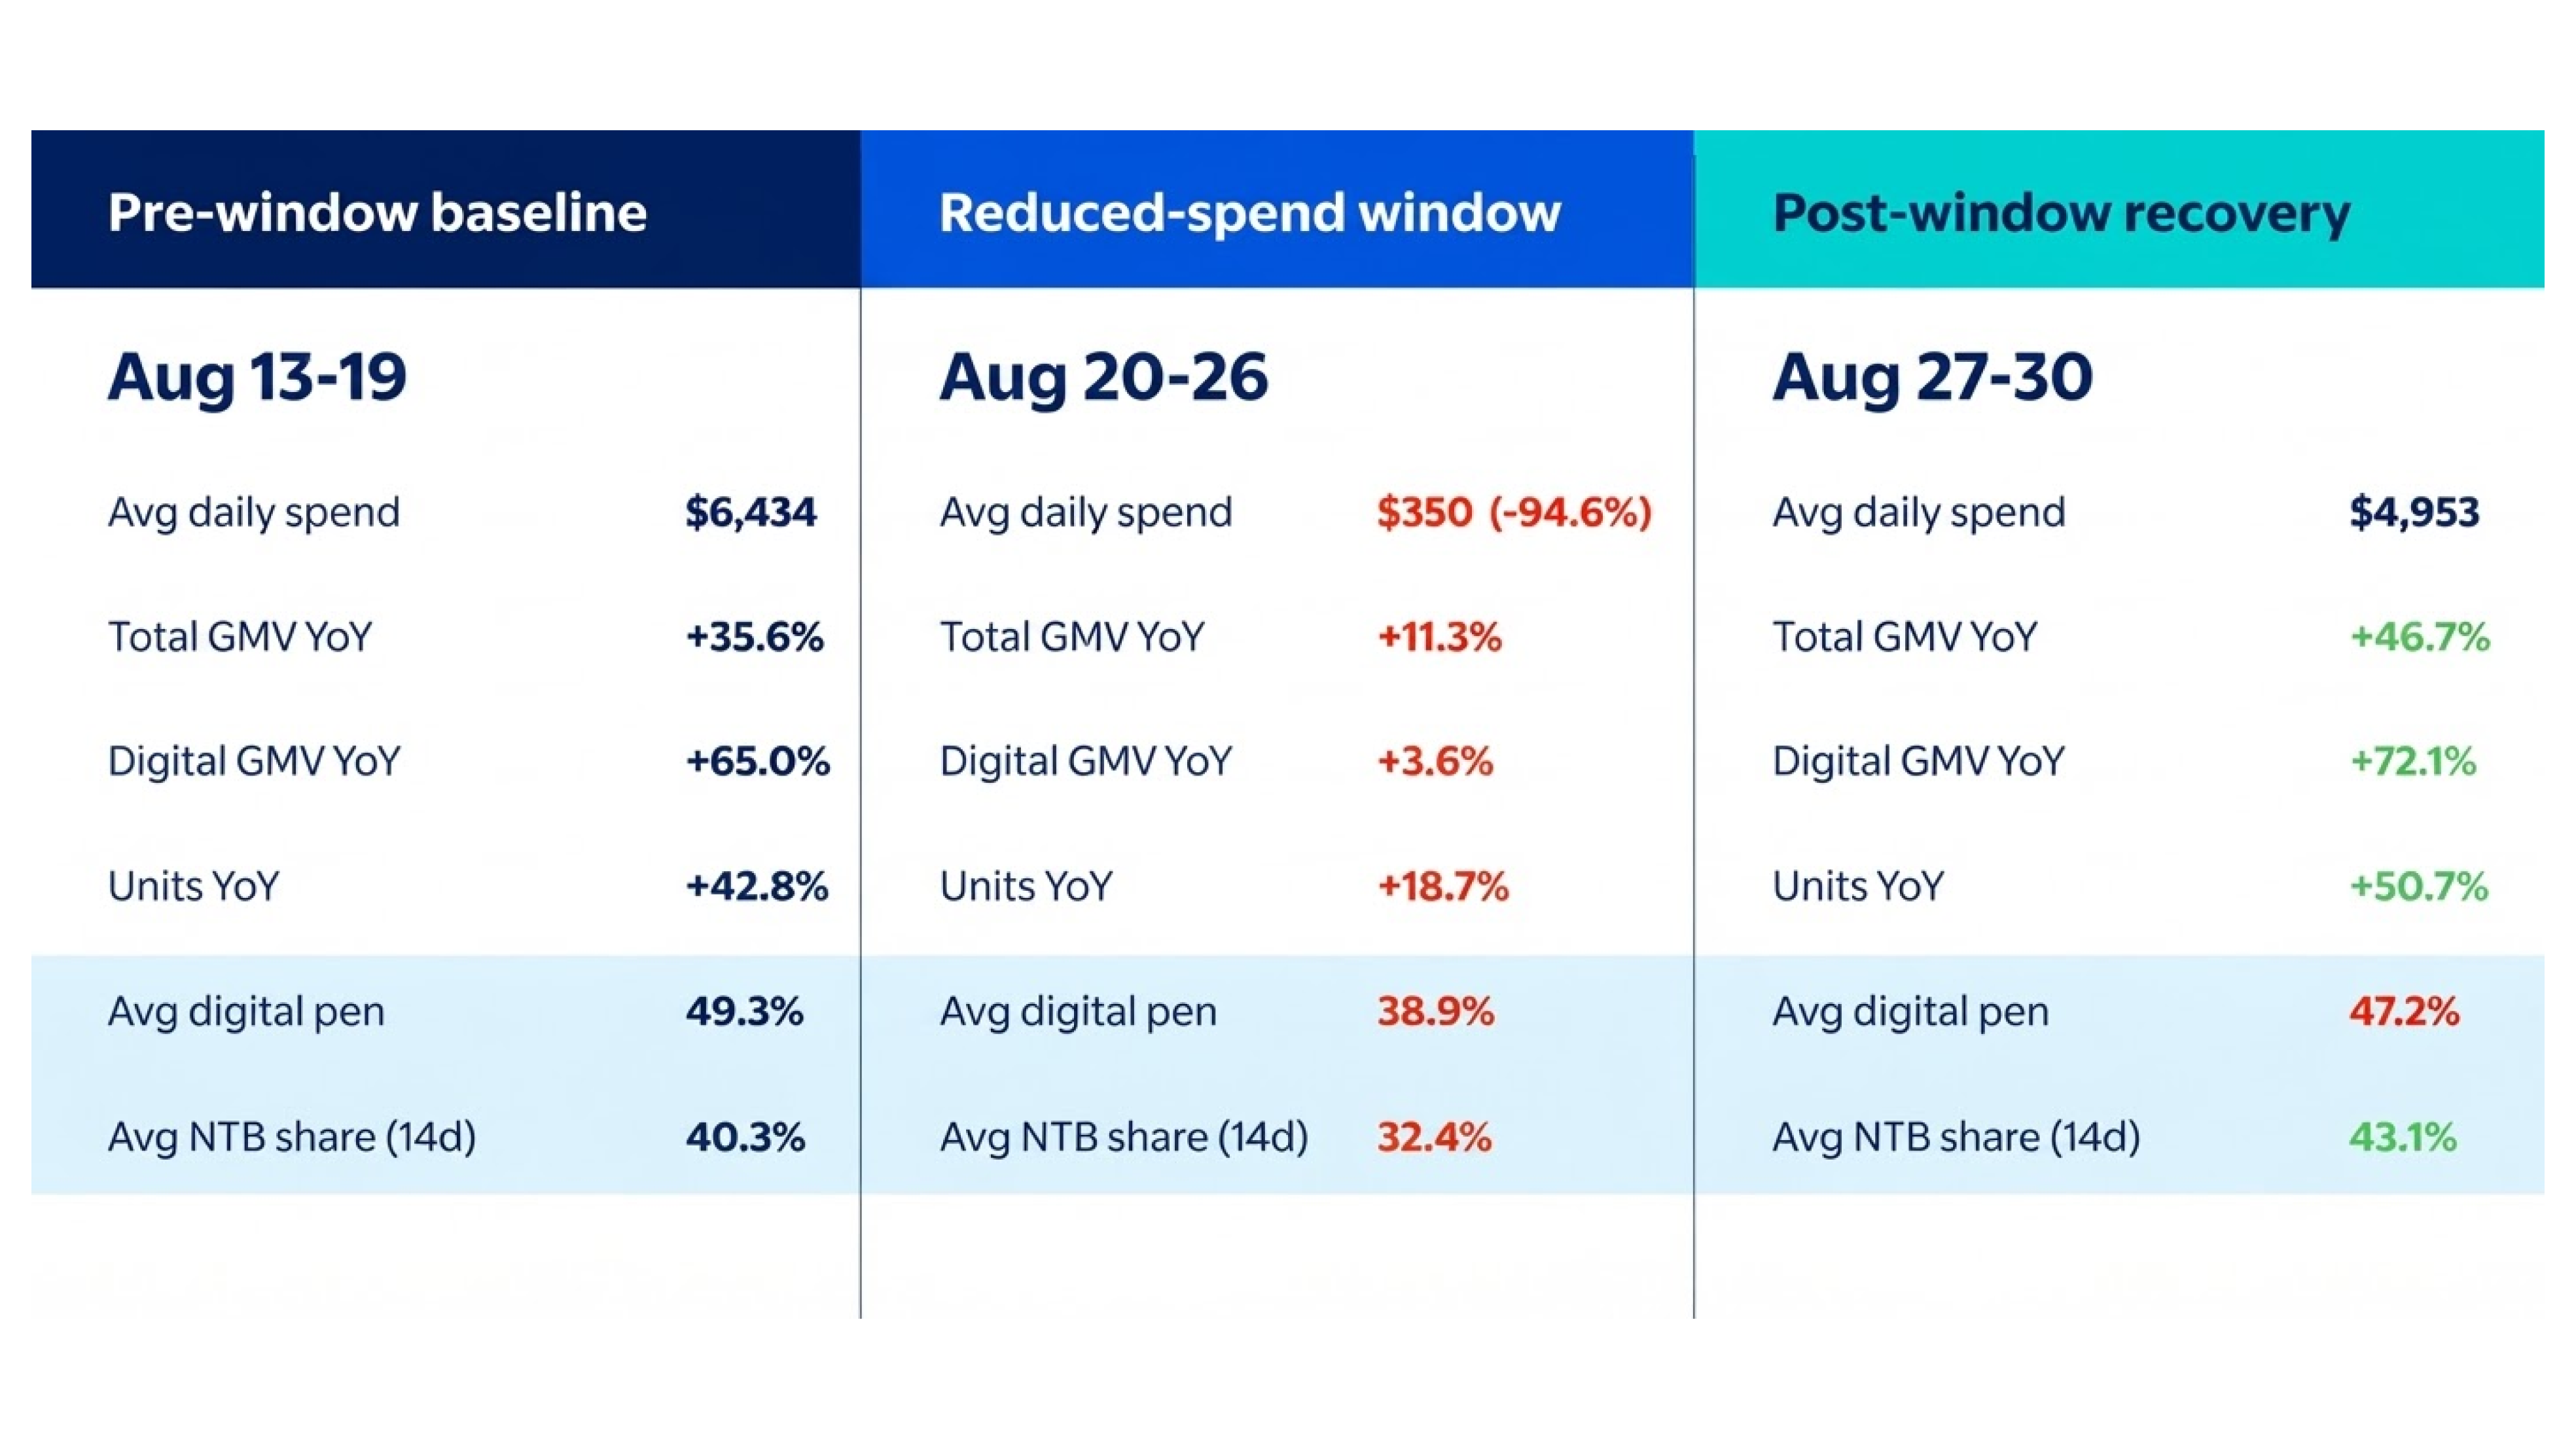
Viewed alongside QBR's incrementality analysis, these trends suggest Search was contributing to broader business growth, rather than simply shifting sales between channels. For growing brands focused on reaching new customers, the pattern is a reason to look beyond attributed sales alone when evaluating advertising's role in growth.
“Showing that Search creates incremental value is one question. Understanding the right level of investment for a particular brand is another. That's where continued testing becomes important.”
— Niccolo Gloazzo, Co-Founder, QBR Media
The next question: What investment level is right for your brand?
The right level will vary based on your category, demand and business goals. Testing different investment levels can show you how incremental value changes as investment increases or decreases, and ultimately how to invest more effectively.
Turn the findings into action
“For growing brands, the question is not only how much revenue was attributed to advertising, but how much growth may have been lost without it. This study shows why incrementality matters: it gives advertisers a clearer view of the business impact of Search and a stronger fact base for deciding how to stay visible, reach new customers and scale investment with confidence.”
— Joshua Keezer, Senior Director, Advertising Sales, Emerging (Food), Walmart
For emerging advertisers, the findings point to three practical lessons:
- Going dark may cost more than you think. This study offers another reason to consider an always-on approach. When Search investment began ramping back up, digital penetration didn't immediately return to baseline levels — suggesting the impact of reduced visibility may extend beyond the period of lower investment. Rather than switching campaigns off entirely during softer periods, consider maintaining an always-on presence around your most important products and keywords, while adjusting bids and budgets as demand changes.
- Look beyond ROAS to understand growth. ROAS tells you how much revenue was attributed to advertising, but it doesn't tell the entire growth story. Consider performance alongside total GMV, digital penetration and new-to-brand metrics to better understand how advertising is contributing to your business.
- Build toward your right investment level. There's no one-size-fits-all budget. Start retail ready and establish a baseline of advertising spend and sales performance. Then, consider testing controlled changes in investment during lower-demand periods, comparing results against similar periods while accounting for factors like seasonality, promotions and inventory. These comparisons can help you explore whether advertising is driving additional growth and inform how you adjust and scale investment over time.
The goal isn't simply to prove that advertising works. It's to keep building the evidence you need to make smarter investment decisions — and invest with greater confidence as your business grows.
Ready to put these insights into practice? Explore how Walmart Connect's Sponsored Search solutions can help you reach more customers, build on your existing strategy and drive business growth.
Methodology: QBR Media built counterfactuals week-over-week using day-of-week-matched Thursday–Wednesday windows, with the prior year's same-week movement used as a seasonality index rather than a growth-rate carry-forward. To test the robustness of the finding, QBR evaluated six reasonable baseline specifications; estimated incremental value per dollar remained within a $0.36 range across those approaches. Regressions are log-log with day-of-week fixed effects and Newey–West (3-lag) standard errors (n=30). Confidence intervals on the incremental GMV estimate come from a 5,000-draw block bootstrap over the paired baseline and reduced-spend weeks. In-store GMV, calculated as total GMV less digital GMV, was used as a placebo outcome to test whether broader demand changes could explain the result.
Source: QBR Media, How to Determine Incrementality on Walmart Connect, analysis of Walmart Connect daily advertising and retail reporting, August 1–31, 2026. Aug 31 carries no reported spend and is excluded from all spend-linked models. Figures are GMV, not net revenue, and are unaudited; New-to-brand definition: Walmart Connect defines a new-to-brand customer as one who purchases a brand's product on Walmart's digital properties as a result of an ad campaign, after not having purchased the brand for the prior 12 months; Disclaimer: No endorsement of third-party data sources.

Ready to get started?
Join Walmart Connect and put our partners, expertise and data to work for you.
You might be interested in





Wherever you are, we’ll help you go further
Launch, optimize, grow—on your terms

 Accessibility